Manhattan Helicopter Maps
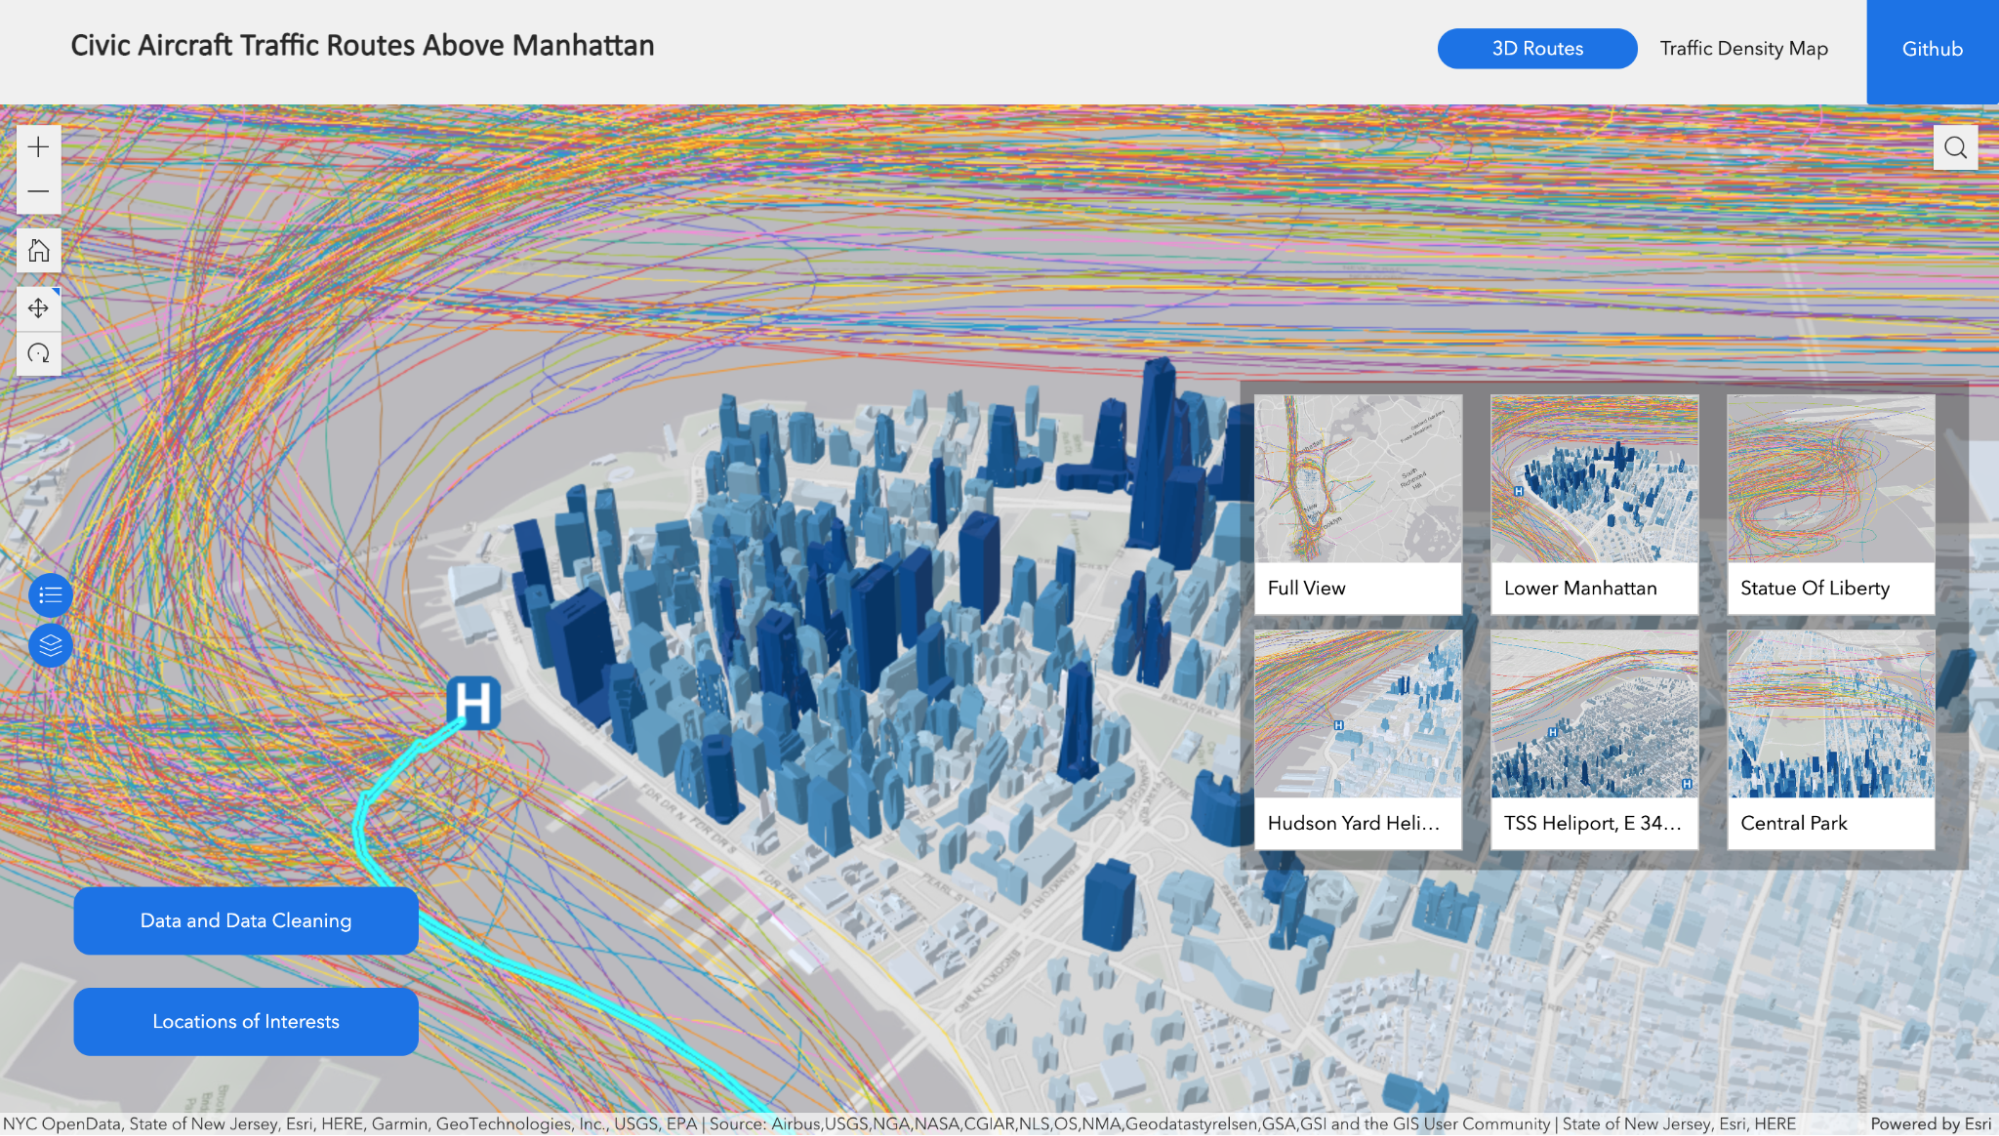
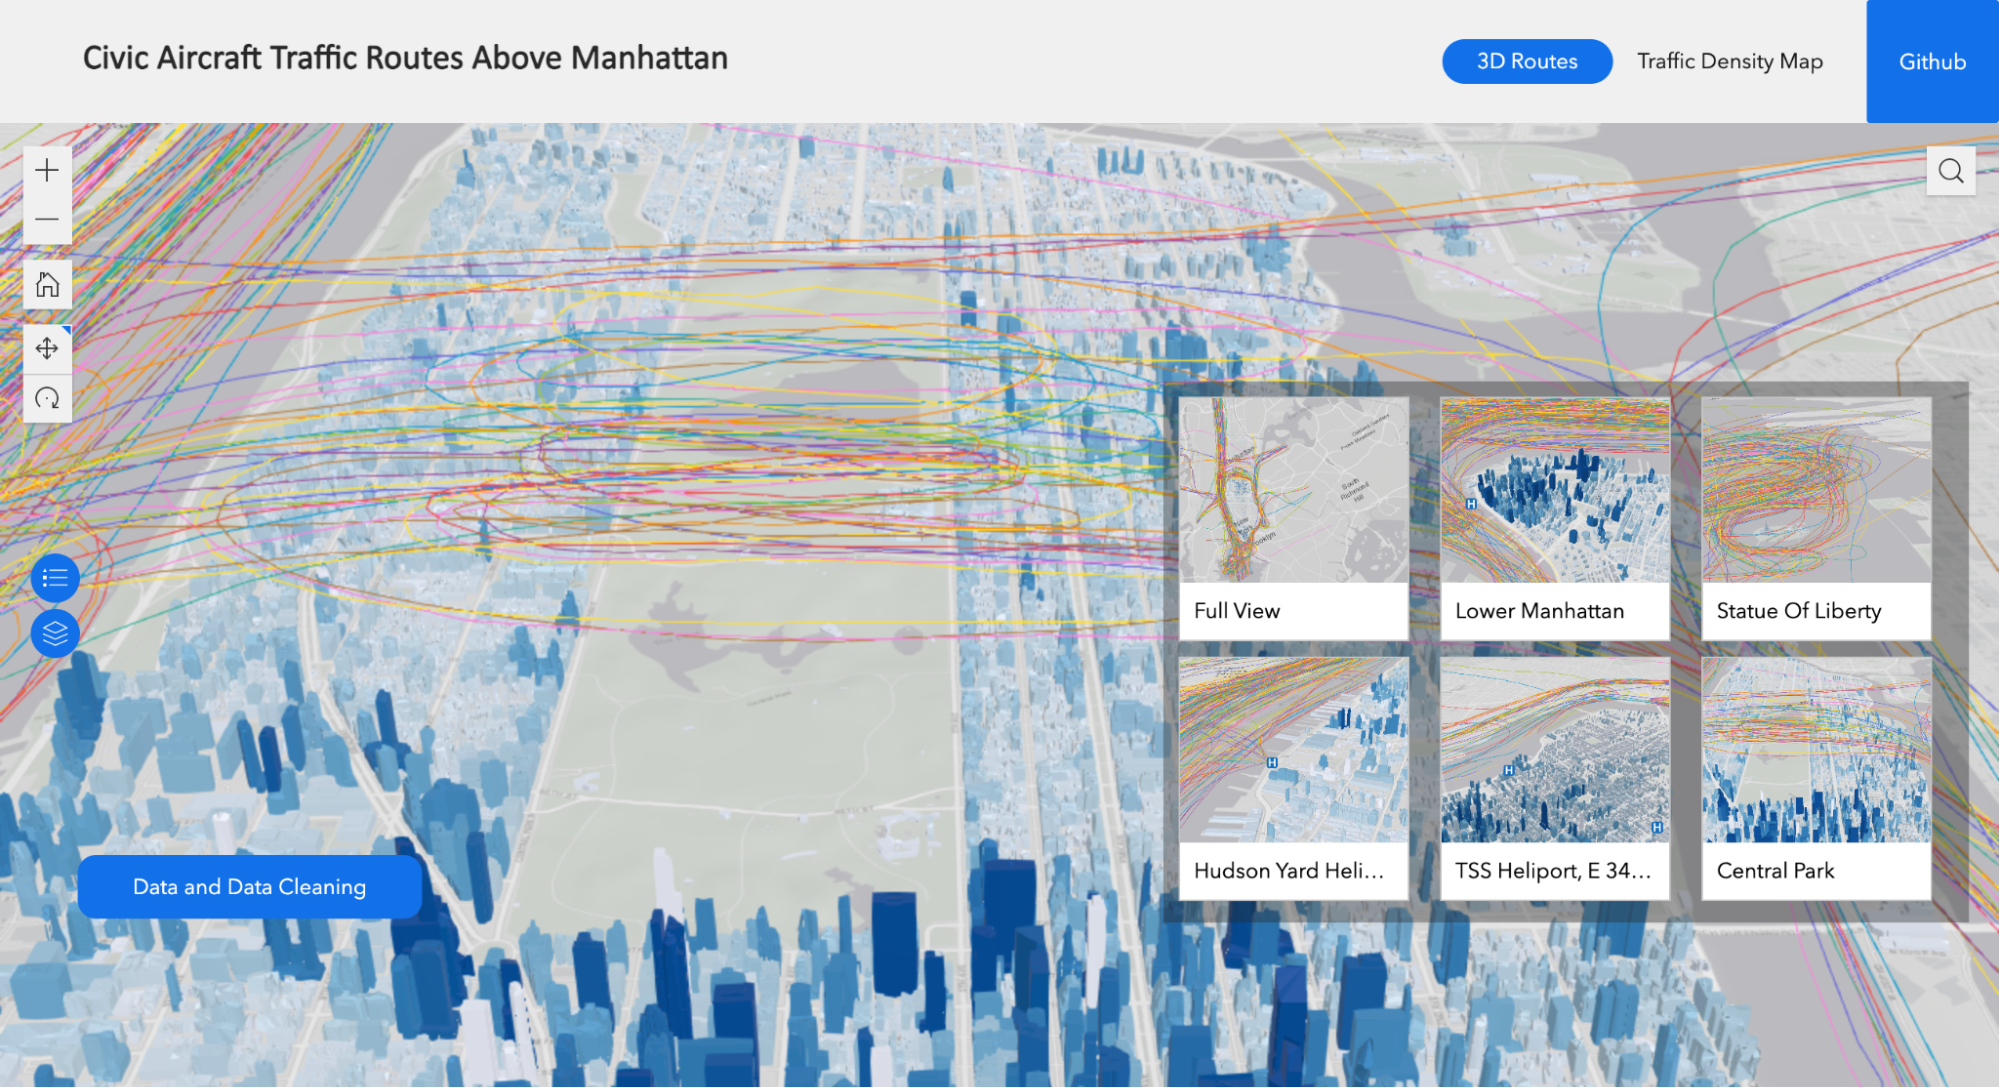
Zigi Wang (MSDAV ‘23) and Jiacheng Chen (MSDAV ‘23) decided to take an incomplete idea from a summer internship and make it happen. They were primarily interested in producing a 3D visual of the helicopter flying routes in Manhattan with time series graphs to show when the city is the busiest with helicopters. The 3D graphs and spatial analysis as well as the dashboard were completed in ArcGIS Online/ArcGIS Pro with data analysis completed in Python. View the completed visualizations here.